Macroeconomic Dashboard: PAKISTAN
Executive Summary
Economic Overview
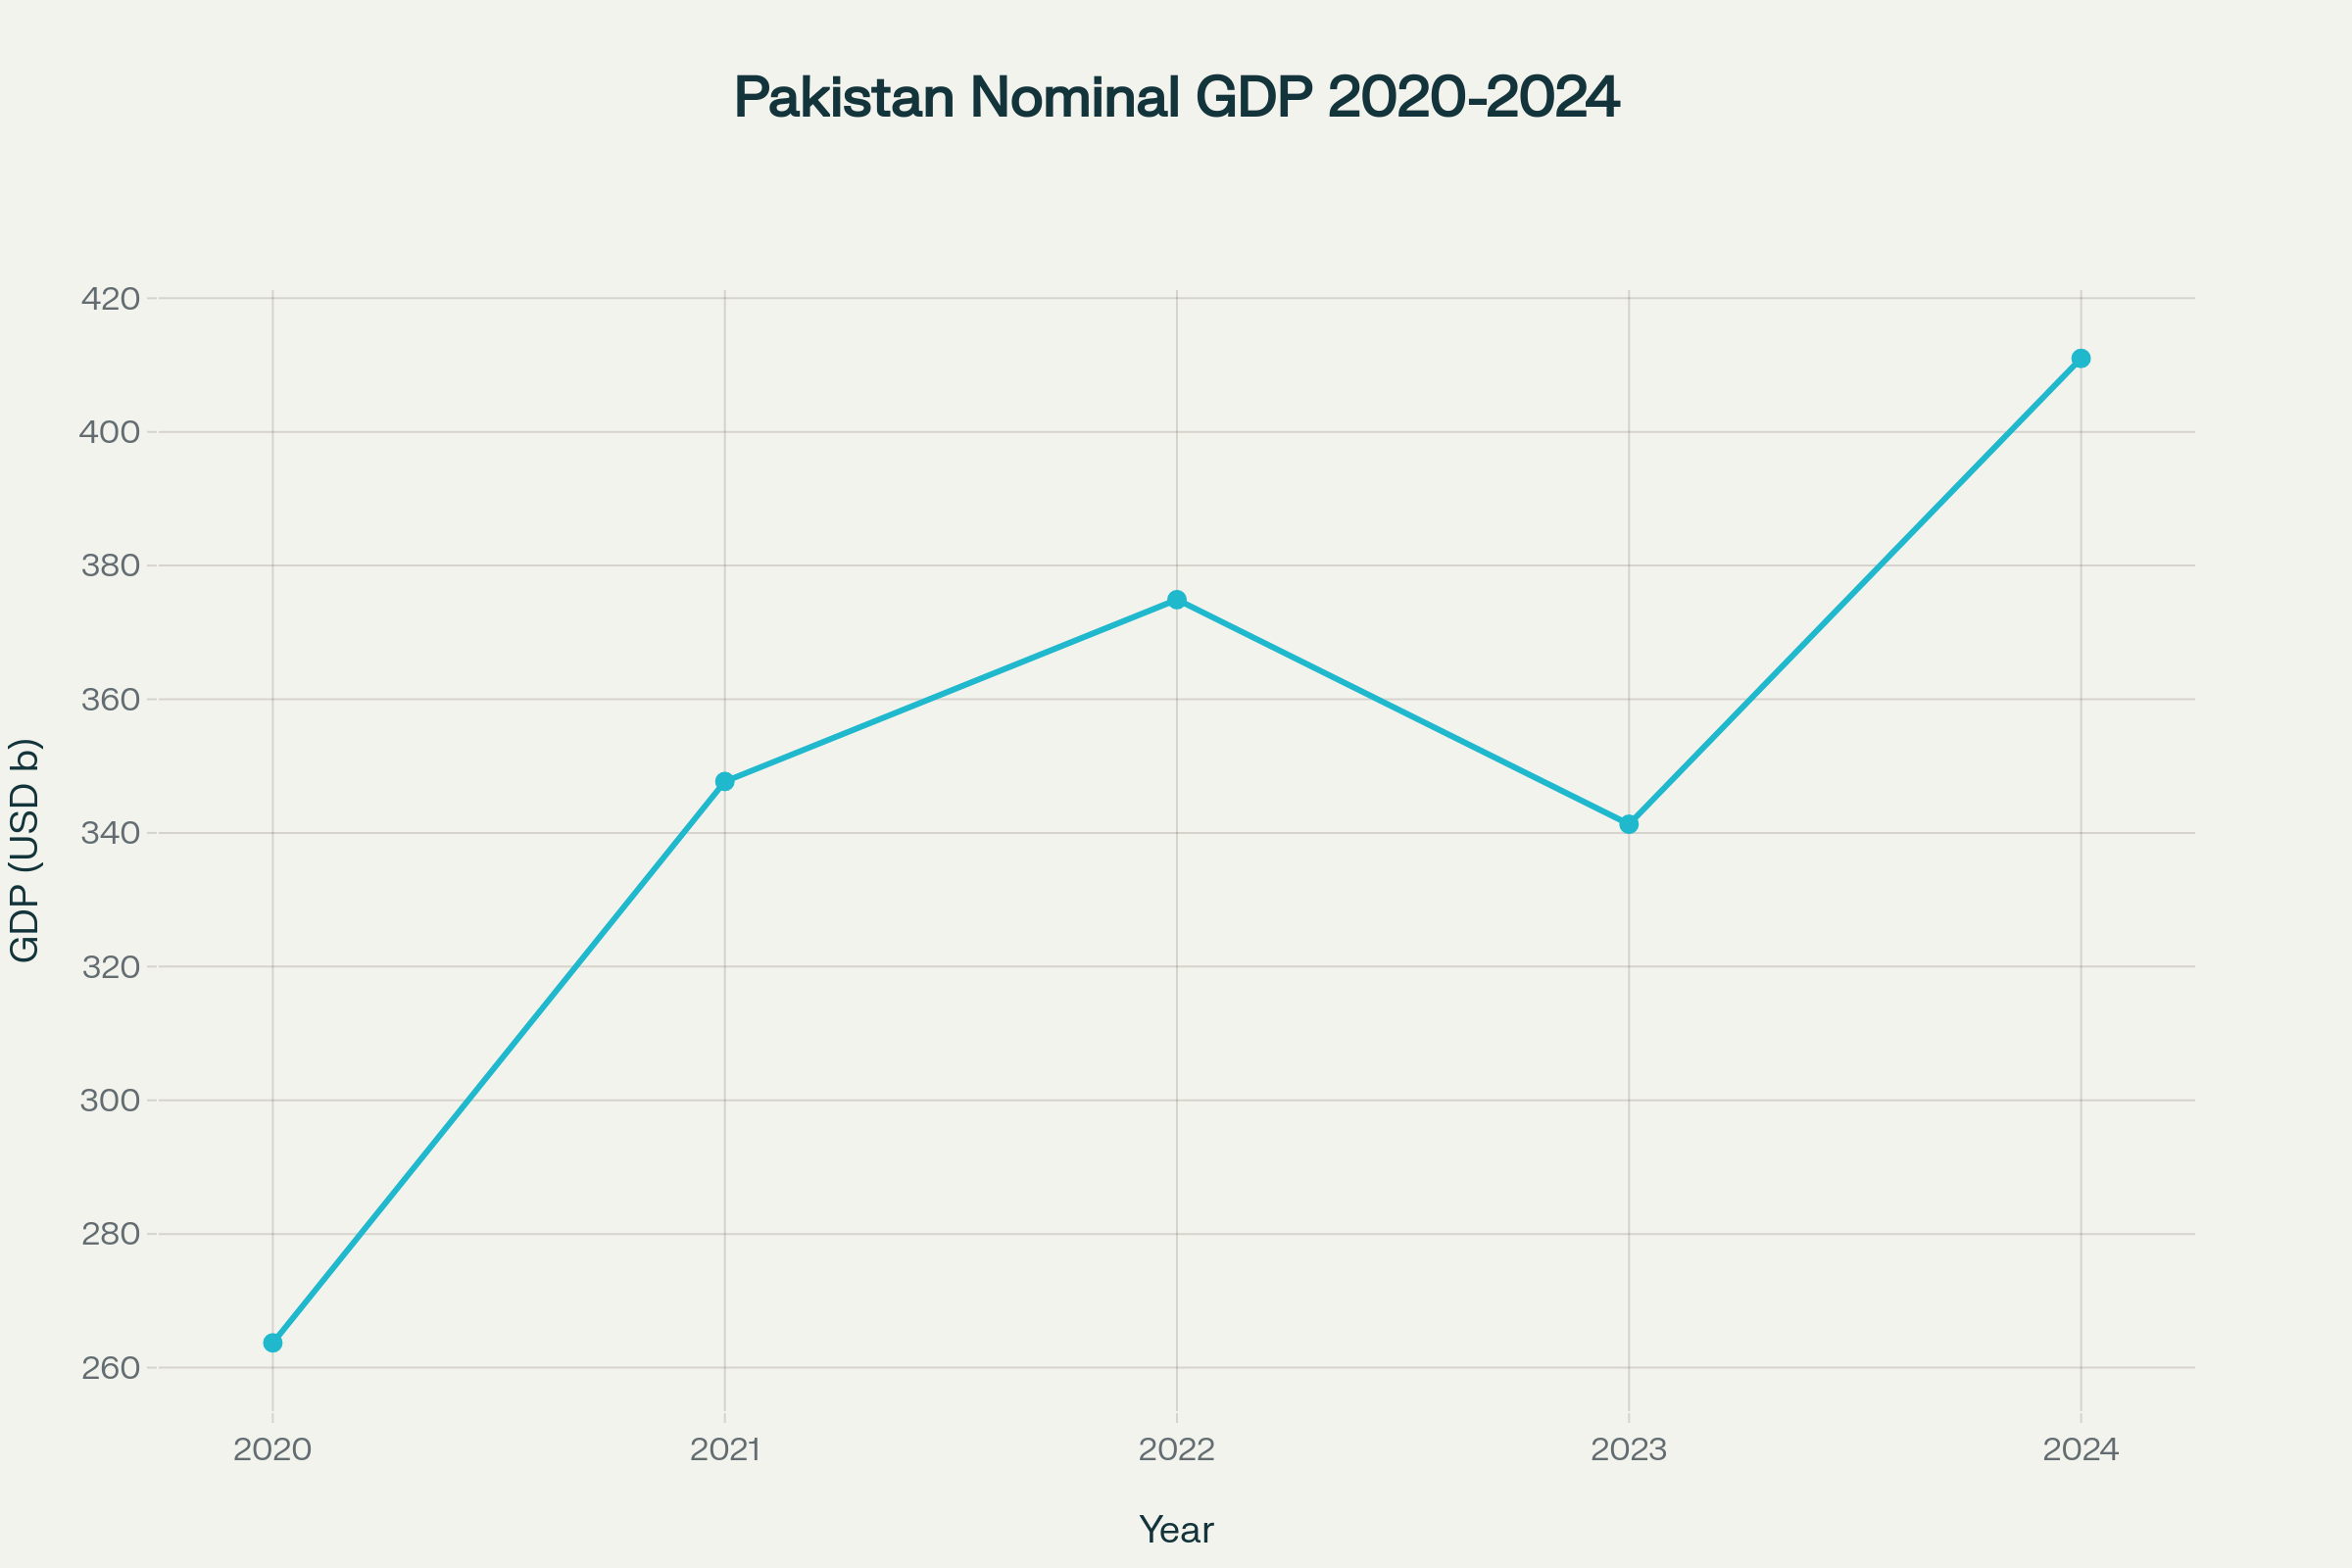
Pakistan's economy has undergone significant volatility over the past five years, marked by acute balance of payments crises, unprecedented inflation peaks, and subsequent stabilization efforts. The country's nominal GDP reached $411.0 billion in 2024, recovering from the 2023 contraction when economic output fell to $341.3 billion amid severe external pressures.
Growth Momentum: Real GDP growth has shown remarkable resilience despite external shocks. After contracting by -0.2% in 2023 during the acute crisis period, growth recovered to 2.5% in 2024. The economy demonstrated its underlying strength with robust expansions of 5.7% in 2021 and 6.0% in 2022, before the external crisis took hold. The services sector continues to dominate, accounting for 57.8% of GDP in 2024, while agriculture remains substantial at 24.0%, providing crucial stability during volatile periods.
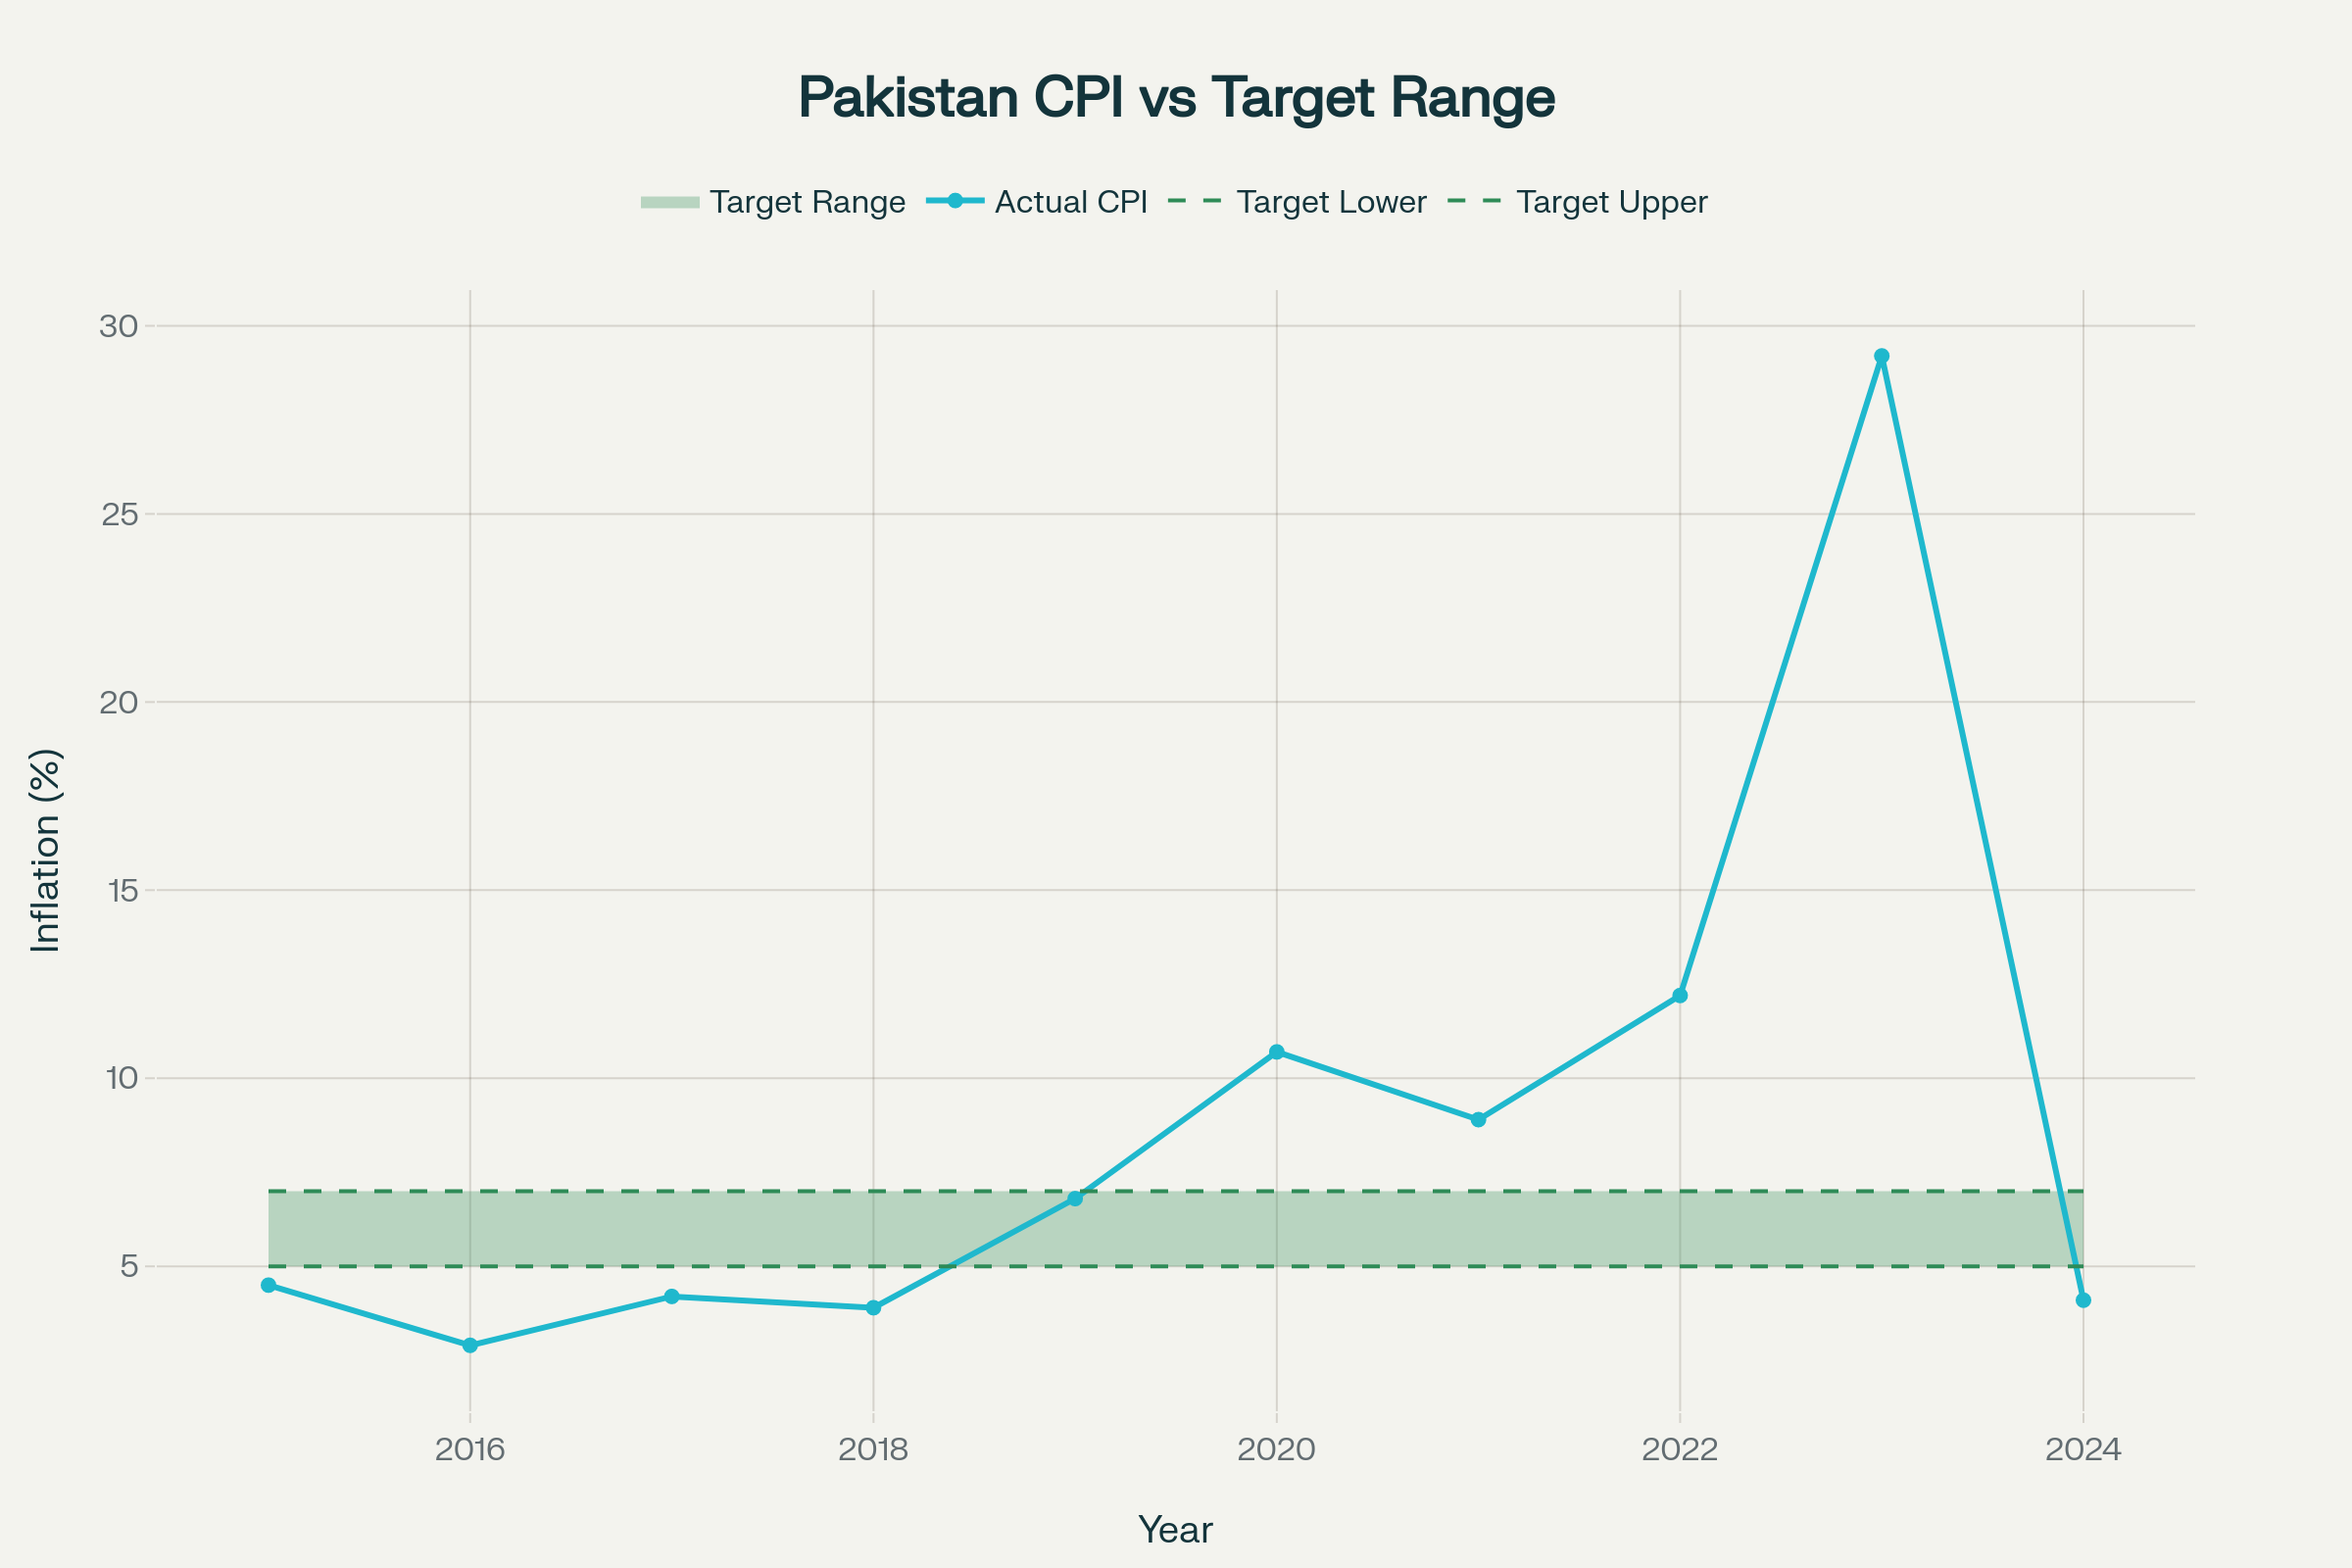
Inflation Dynamics: Pakistan experienced one of the most dramatic inflation episodes globally, with headline CPI surging to 29.2% in 2023 from 12.2% in 2022. This surge was driven by currency depreciation, supply-side shocks, and expansionary fiscal policies. However, aggressive monetary tightening and improved external conditions have brought inflation down dramatically to 4.1% by 2024, now approaching the central bank's 5-7% target range.
Monetary Policy Stance: The State Bank of Pakistan (SBP) implemented aggressive monetary tightening, raising the policy rate from 7.25% in 2021 to a peak of 22.0% in 2023. With inflation declining rapidly, the central bank began an easing cycle in mid-2024, reducing rates to 11.0% by year-end. This normalization reflects improved inflation expectations and external stability.
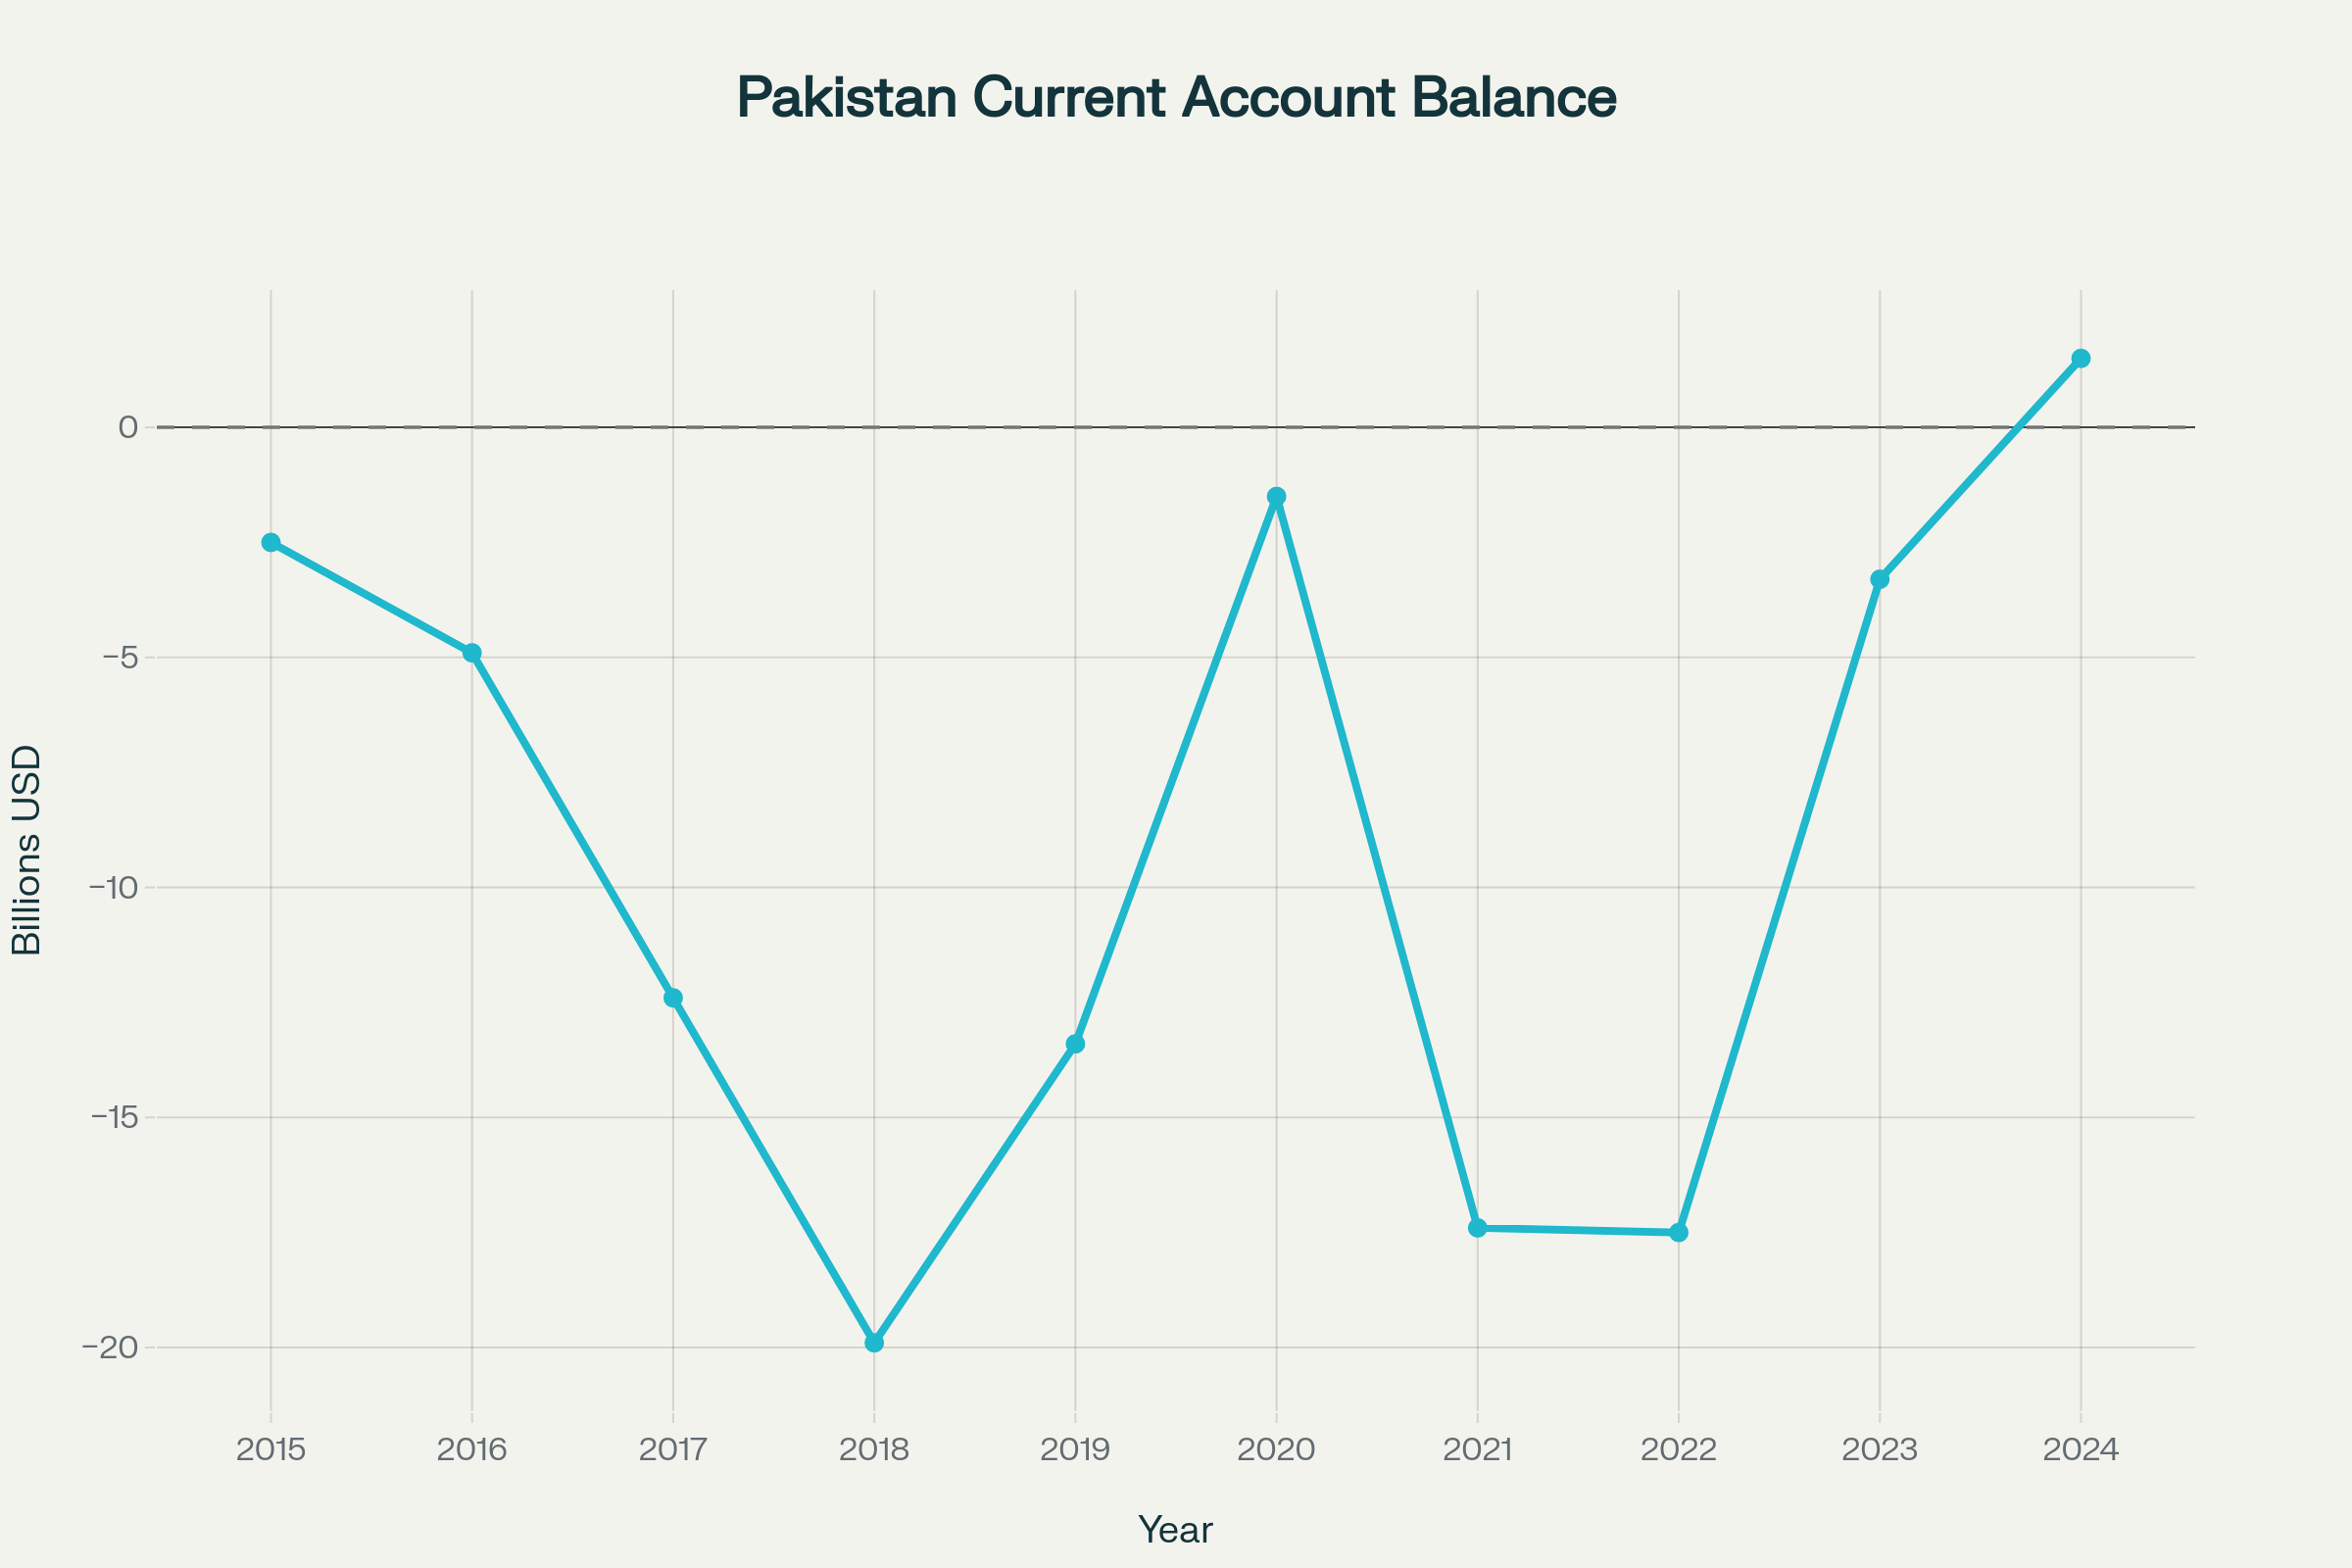
External Headwinds and Tailwinds: The external sector has been the primary source of volatility. Foreign exchange reserves plummeted from $17.3 billion in 2021 to critically low levels of $4.6 billion in 2022, forcing severe import restrictions. However, IMF support programs, improved current account dynamics, and policy adjustments have restored reserves to $14.5 billion by 2024. The current account achieved a rare surplus of $1.5 billion in 2024, the first positive balance since 2015, reflecting both compressed imports and resilient remittances.
Key Events Timeline
- July 2023: IMF Stand-by Arrangement approved ($3bn) - Provided crucial financial support and policy anchor during crisis.
- February 2024: General elections held - Reduced political uncertainty with coalition government formation.
- June 2024: Policy rate cuts begin from 22% peak - Monetary easing cycle supports economic recovery.
- September 2024: New IMF Extended Fund Facility approved ($7bn) - Long-term support for structural reforms and stability.
- Q4 2024: Current account surplus achieved - First external balance surplus in years signals improvement.
Upcoming Events Calendar
GDP and Economic Output
Annual GDP Data (2015-2024)
| Metric | 2015 | 2016 | 2017 | 2018 | 2019 | 2020 | 2021 | 2022 | 2023 | 2024 |
|---|---|---|---|---|---|---|---|---|---|---|
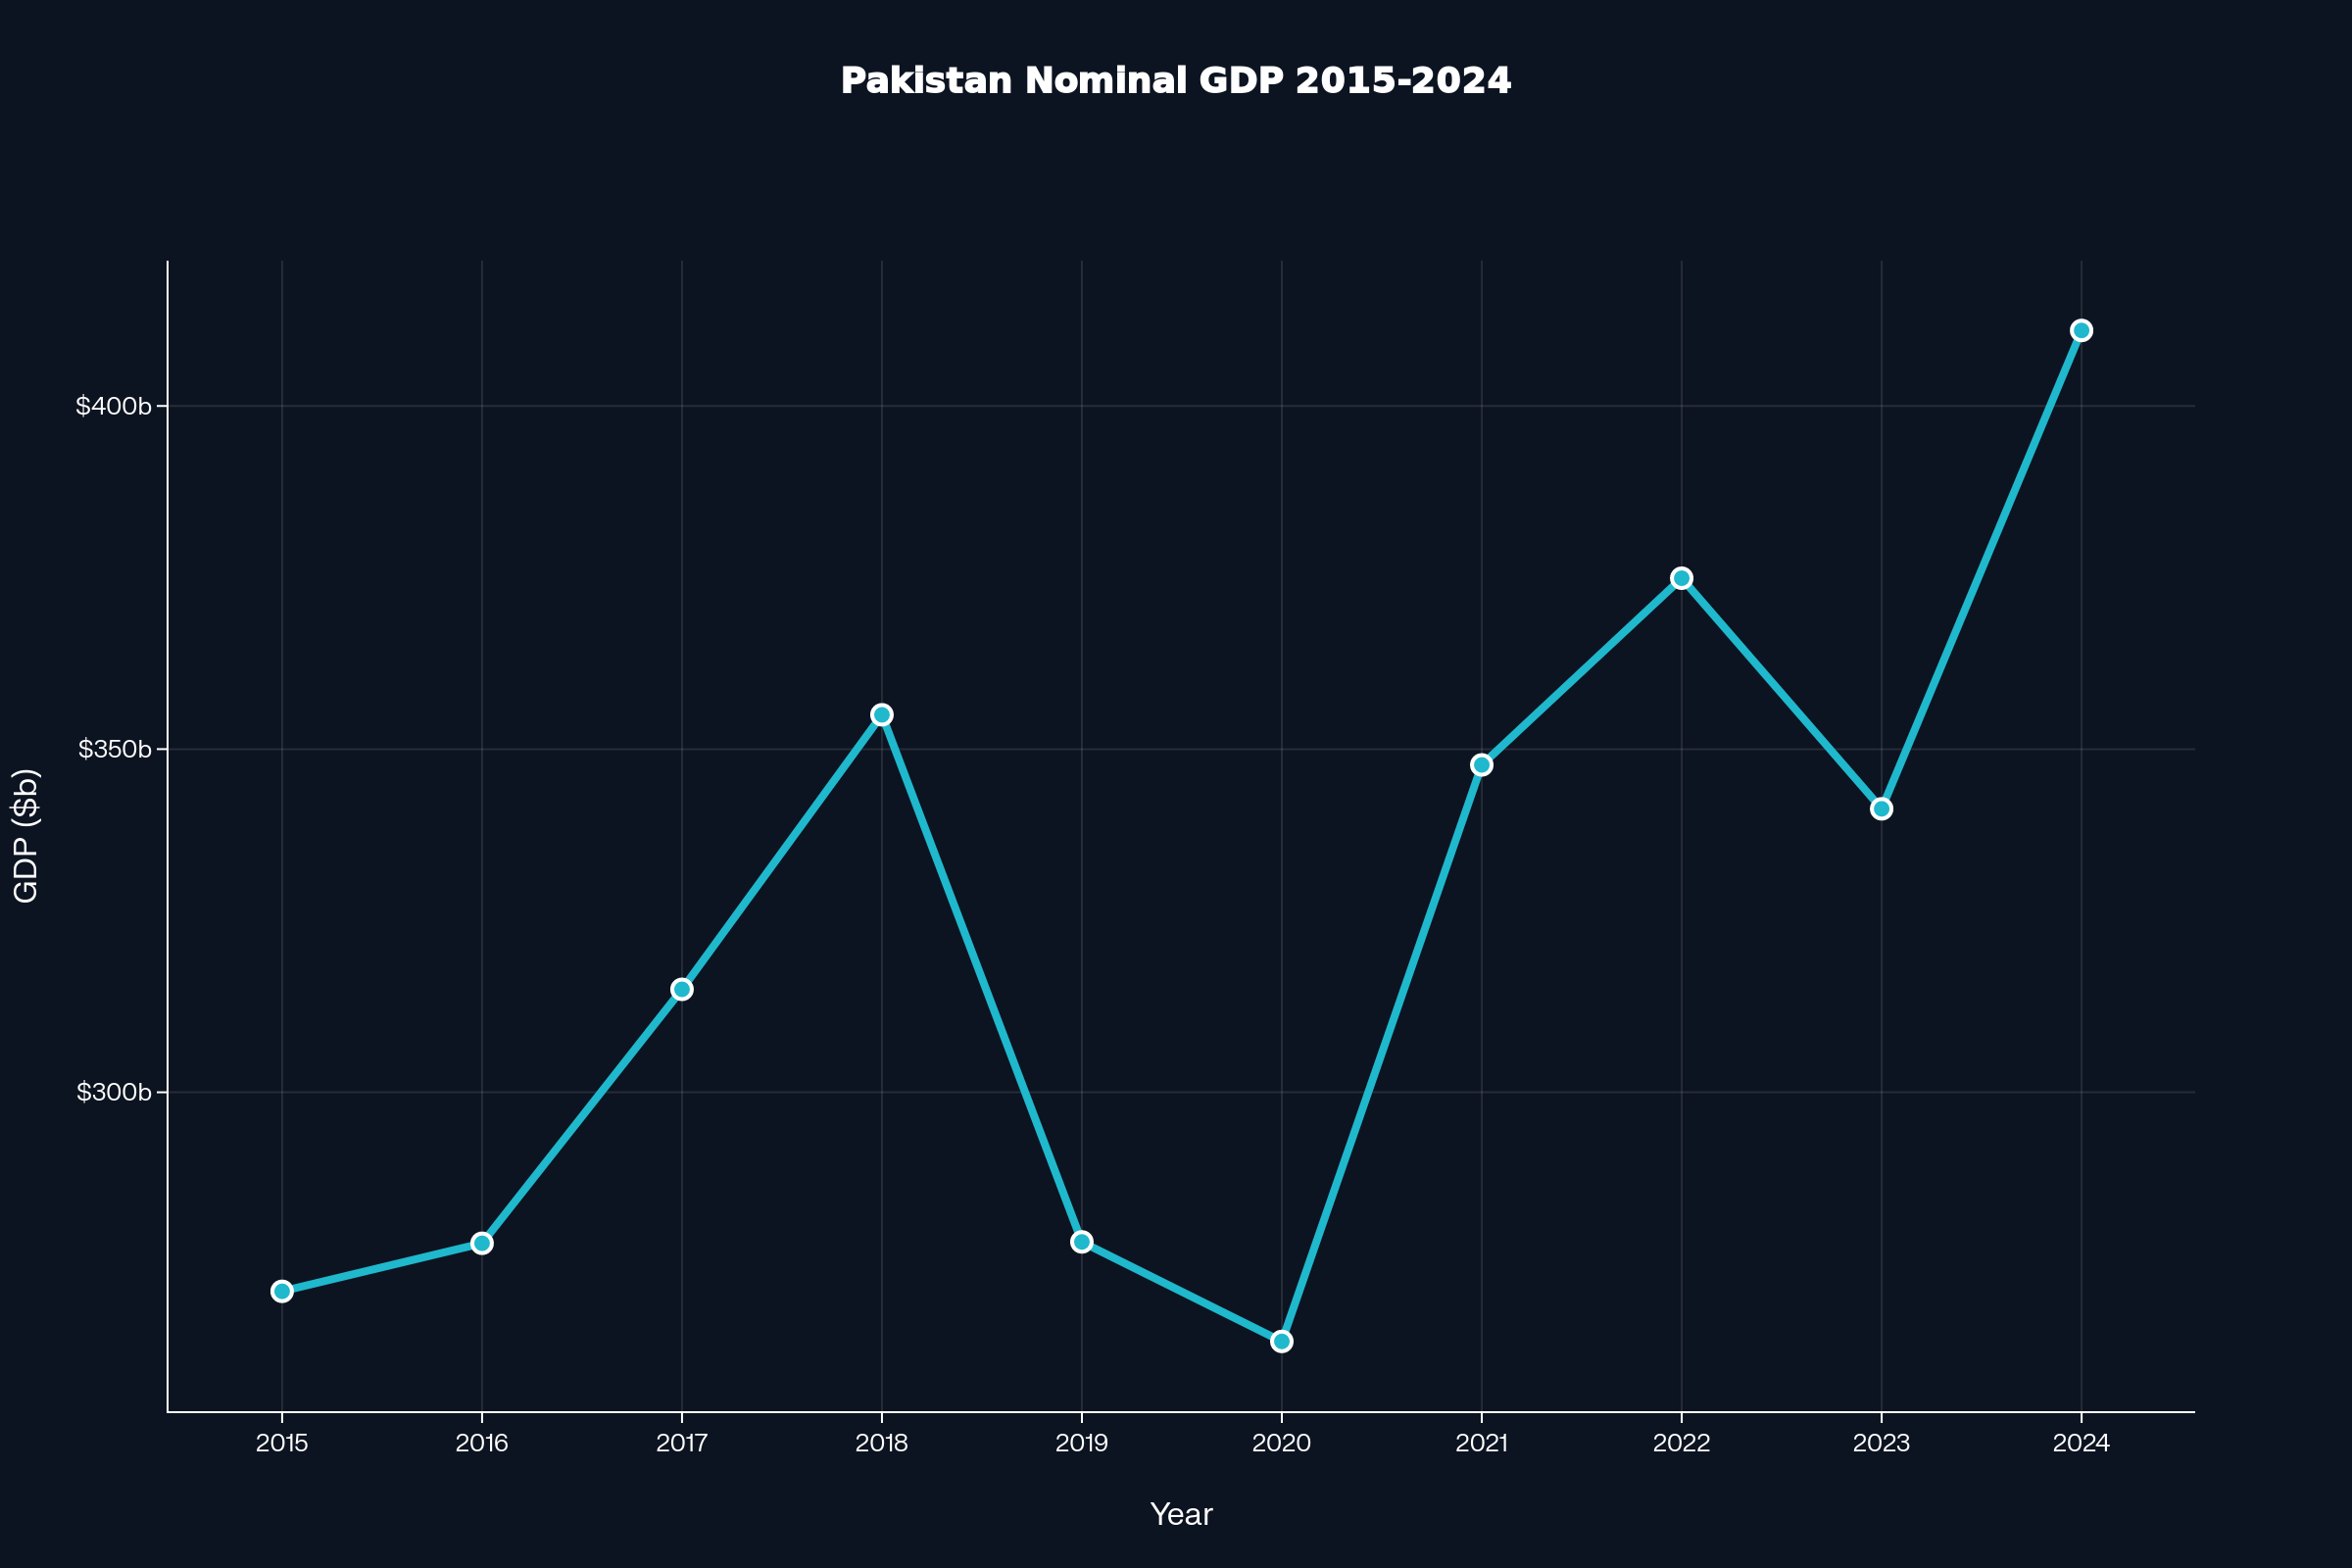
| Nominal GDP ($B) | 271.0 | 278.0 | 315.0 | 355.0 | 278.2 | 263.7 | 347.7 | 374.9 | 341.3 | 411.0 |
| Real GDP Growth (%) | 4.1 | 4.6 | 5.2 | 5.8 | 1.9 | -0.9 | 5.7 | 6.0 | -0.2 | 2.5 |
| Agriculture (%) | 25.2 | 24.5 | 24.1 | 23.4 | 22.7 | 22.9 | 23.0 | 23.2 | 24.0 | 24.0 |
| Industry (%) | 20.9 | 20.1 | 19.8 | 19.3 | 19.1 | 18.9 | 18.6 | 18.4 | 18.3 | 18.2 |
| Services (%) | 53.9 | 55.4 | 56.1 | 57.3 | 58.2 | 58.2 | 58.4 | 58.4 | 57.7 | 57.8 |
Source: State Bank of Pakistan, Pakistan Bureau of Statistics
GDP Analysis
Pakistan's GDP trajectory over the past decade reflects the economy's inherent volatility and resilience to external shocks. The nominal GDP reached its peak of $411.0 billion in 2024, representing a strong recovery from the 2023 contraction. The economy demonstrated remarkable growth momentum between 2017-2018, with real GDP expanding at 5.2% and 5.8% respectively, driven by infrastructure investments under the China-Pakistan Economic Corridor (CPEC) and improved security conditions.
The sectoral composition reveals a gradual structural transformation toward a service-oriented economy. Services now account for 57.8% of GDP, up from 53.9% in 2015, reflecting Pakistan's integration into global value chains and growing domestic consumption. Agriculture's share has stabilized around 24%, providing crucial stability during crisis periods, while industry's contribution has declined from 20.9% to 18.2%, indicating deindustrialization pressures that warrant policy attention.
The 2019-2020 period marked a significant inflection point, with growth slowing to 1.9% in 2019 and contracting by -0.9% in 2020 due to IMF-mandated fiscal consolidation and COVID-19 impacts. However, the economy rebounded strongly in 2021-2022 with growth rates of 5.7% and 6.0%, demonstrating underlying resilience. The 2023 contraction of -0.2% was primarily driven by external sector constraints and import compression, rather than fundamental structural weaknesses.
According to the State Bank of Pakistan's latest monetary policy statement, the central bank expects GDP growth to normalize at 2.5-3.5% over the medium term, supported by stabilizing external conditions and ongoing structural reforms under the Extended Fund Facility. The Ministry of Finance projects that industrial recovery and agricultural productivity improvements will support sustainable growth momentum going forward.
Inflation and Price Trends
Annual Inflation Data (2015-2024)
| Metric | 2015 | 2016 | 2017 | 2018 | 2019 | 2020 | 2021 | 2022 | 2023 | 2024 |
|---|---|---|---|---|---|---|---|---|---|---|
| Headline CPI (%) | 4.5 | 2.9 | 4.2 | 3.9 | 6.8 | 10.7 | 8.9 | 12.2 | 29.2 | 4.1 |
| Core CPI (%) | 5.2 | 4.8 | 5.1 | 5.8 | 8.5 | 7.9 | 6.5 | 10.1 | 18.4 | 9.7 |
| Policy Rate (%) | 6.0 | 5.75 | 5.75 | 6.25 | 13.25 | 7.0 | 7.25 | 16.0 | 22.0 | 13.0 |
| Target Range | 5-7% | 5-7% | 5-7% | 5-7% | 5-7% | 5-7% | 5-7% | 5-7% | 5-7% | 5-7% |
Source: Pakistan Bureau of Statistics, State Bank of Pakistan
Inflation Analysis
Pakistan's inflation trajectory presents a tale of two distinct phases: the prolonged period of moderate inflation from 2015-2022, followed by the acute inflationary shock of 2023 and subsequent rapid disinflation. The headline CPI surge to 29.2% in 2023 represented one of the highest inflation rates globally, driven primarily by currency depreciation, supply-side disruptions, and expansionary fiscal policies during the external crisis.
The inflation spike was broad-based but particularly severe in food and energy components. Core CPI, which excludes volatile items, reached 18.4% in 2023, indicating that inflationary pressures were deeply embedded across the economy. The persistence of core inflation above headline inflation during 2015-2019 suggested underlying demand pressures and structural rigidities in the economy. However, the dramatic reversal in 2024, with headline inflation falling to 4.1% while core remained elevated at 9.7%, reflects the dominance of base effects and energy price normalization.
Supply-side factors played a crucial role throughout the period. Import restrictions imposed during the foreign exchange crisis contributed to domestic shortages and price pressures. Additionally, frequent adjustments in administered prices, particularly fuel and electricity tariffs mandated under IMF programs, created recurring inflationary impulses. The Pakistan Bureau of Statistics data shows that housing and utilities inflation remained persistently elevated, reflecting structural supply constraints in these sectors.
The State Bank of Pakistan's aggressive monetary response, raising policy rates from 7.25% to 22.0%, was instrumental in anchoring inflation expectations and restoring credibility. The central bank's latest Monetary Policy Statement indicates that inflation expectations have normalized significantly, with forward-looking indicators suggesting convergence toward the 5-7% target range by mid-2025. However, risks remain from potential fiscal slippages and external price shocks, requiring continued vigilance from policymakers.
Monetary Policy Analysis
Current Policy Snapshot
Monetary Policy Stance
The State Bank of Pakistan has navigated one of the most challenging monetary policy environments in its history, implementing aggressive tightening during the 2022-2023 crisis before transitioning to gradual easing in 2024. The policy rate peaked at 22.0% in May 2023, representing the highest level since the bank's inception, as policymakers sought to restore macroeconomic stability and anchor inflation expectations amid acute external pressures.
The central bank's forward guidance has emphasized a data-dependent approach to policy normalization. With headline inflation falling dramatically to 4.1% and core inflation showing signs of deceleration, the SBP initiated an easing cycle in June 2024, reducing rates by 450 basis points to 11.0% by year-end. The Monetary Policy Committee's latest statement highlights improved inflation expectations, strengthening external accounts, and stabilizing currency as key factors supporting the easing stance.
Liquidity management has been another critical dimension of monetary policy. The central bank maintained tight liquidity conditions throughout 2023 through open market operations and higher reserve requirements. However, with improving external conditions and increased foreign currency inflows, the SBP has gradually normalized liquidity conditions, supporting credit growth recovery. The real interest rate remains elevated at approximately 6.9%, providing continued anti-inflationary anchor while supporting external stability.
Looking ahead, the SBP's monetary policy framework emphasizes flexible inflation targeting within the 5-7% range over the medium term. The central bank has signaled continued gradual easing, contingent on sustained disinflation and external stability. However, risks from potential fiscal slippages, global commodity price volatility, and geopolitical tensions require maintaining policy flexibility and readiness to adjust the stance as conditions evolve.
Labor Market Dynamics
Labor Market Indicators
| Metric | 2018 | 2019 | 2021 | 2024 |
|---|---|---|---|---|
| Unemployment Rate (%) | 7.2 | 6.9 | 6.3 | 5.5 |
| Labor Force Participation (%) | 31.6 | 32.1 | 32.3 | 32.5 |
Source: Pakistan Bureau of Statistics, Labour Force Survey
Labor Market Analysis
Pakistan's labor market has shown gradual improvement over recent years, with unemployment declining from 7.2% in 2018 to 5.5% in 2024. This improvement reflects the economy's resilience and job creation capacity despite external sector volatility. The decline in unemployment has been accompanied by modest increases in labor force participation, rising from 31.6% to 32.5% over the same period, though participation remains low by international standards, particularly for women.
The labor market's structure remains dominated by informal employment, with agriculture and services sectors absorbing the majority of the workforce. The Pakistan Bureau of Statistics indicates that youth unemployment remains elevated, presenting ongoing challenges for policymakers. Skills mismatches and limited industrial employment opportunities continue to constrain formal job creation, despite the economy's overall growth trajectory.
Wage dynamics have been influenced by inflationary pressures and productivity trends. While comprehensive wage data is limited, anecdotal evidence from the State Bank's surveys suggests that nominal wage growth accelerated during the high inflation period of 2022-2023 but remained below inflation rates, implying real wage compression. The normalization of inflation in 2024 is expected to support real wage recovery, contingent on continued economic stability.
Demographic trends present both opportunities and challenges for Pakistan's labor market. With approximately 64% of the population under 30 years of age, the country faces the challenge of creating sufficient employment opportunities for a rapidly growing workforce. However, this demographic dividend also represents a significant growth opportunity if supported by appropriate education, skills development, and job creation policies. The government's focus on digitalization and export-oriented industries aims to leverage this demographic advantage while addressing structural employment challenges.
Fiscal Position and Debt
Fiscal Indicators (2015-2024)
| Metric | 2015 | 2016 | 2017 | 2018 | 2019 | 2020 | 2021 | 2022 | 2023 | 2024 |
|---|---|---|---|---|---|---|---|---|---|---|
| Fiscal Balance (% GDP) | -5.3 | -4.6 | -5.8 | -6.4 | -8.9 | -7.1 | -7.2 | -7.9 | -7.4 | -6.8 |
| Public Debt (% GDP) | 63.8 | 67.6 | 72.5 | 89.1 | 87.2 | 91.7 | 89.0 | 89.2 | 91.0 | 80.0 |
Source: Ministry of Finance, State Bank of Pakistan
Fiscal Analysis
Pakistan's fiscal position has remained under persistent strain over the past decade, with the fiscal deficit averaging 6.8% of GDP since 2015. The deficit peaked at -8.9% in 2019 during the previous IMF program and has shown modest improvement to -6.8% in 2024, though it remains well above sustainable levels. The Ministry of Finance's latest fiscal accounts indicate that revenue mobilization remains weak, with tax-to-GDP ratios among the lowest globally, while expenditure pressures from debt servicing and subsidies continue to constrain fiscal space.
Public debt dynamics present a critical vulnerability, with debt-to-GDP ratios rising from 63.8% in 2015 to a peak of 91.7% in 2020. While the ratio declined to 80.0% in 2024, this improvement primarily reflects nominal GDP growth rather than absolute debt reduction. The composition of debt has shifted toward expensive domestic borrowing during periods of external stress, increasing debt servicing costs. Interest payments now consume approximately 45% of total revenues, severely limiting the government's fiscal maneuverability.
The current Extended Fund Facility with the IMF mandates ambitious fiscal consolidation targets, aiming to reduce the primary deficit to 0.4% of GDP by FY2027. Key reform measures include broadening the tax base, eliminating energy subsidies, and improving public financial management. However, implementation risks remain high given Pakistan's history of fiscal slippages and political economy constraints. The Federal Board of Revenue's efforts to digitize tax collection and expand the taxpayer base represent crucial steps toward sustainable fiscal consolidation.
Debt sustainability analysis by the IMF and World Bank indicates that Pakistan's debt remains sustainable under the baseline scenario but is vulnerable to shocks. The government's Debt Policy Statement emphasizes lengthening debt maturity profiles and increasing reliance on concessional financing. However, achieving debt sustainability will require sustained primary surpluses and structural reforms to boost growth potential, presenting significant implementation challenges for policymakers.
External Sector Analysis
External Sector Data (2015-2024)
| Metric | 2015 | 2016 | 2017 | 2018 | 2019 | 2020 | 2021 | 2022 | 2023 | 2024 |
|---|---|---|---|---|---|---|---|---|---|---|
| Current Account ($B) | -2.5 | -4.9 | -12.4 | -19.9 | -13.4 | -1.5 | -17.4 | -17.5 | -3.3 | 1.5 |
| FX Reserves ($B) | 20.0 | 24.0 | 16.1 | 9.8 | 7.2 | 12.9 | 17.3 | 4.6 | 8.0 | 14.5 |
| Exchange Rate (PKR/$) | 102 | 104 | 105 | 122 | 155 | 161 | 162 | 205 | 287 | 278 |
Source: State Bank of Pakistan, Ministry of Commerce
External Sector Analysis
Pakistan's external sector has been the primary source of macroeconomic volatility over the past decade, characterized by recurring balance of payments crises and structural imbalances. The current account deficit reached unsustainable levels of $19.9 billion (5.6% of GDP) in 2018, forcing the country to seek IMF assistance. However, the achievement of a current account surplus of $1.5 billion in 2024 represents a remarkable turnaround, driven by compressed imports, resilient remittances, and improved export performance.
Foreign exchange reserves have exhibited extreme volatility, falling from $24.0 billion in 2016 to critically low levels of $4.6 billion in 2022, equivalent to less than one month of imports. This reserve depletion forced severe import restrictions and contributed to domestic shortages and inflationary pressures. The recovery to $14.5 billion by 2024, while substantial, still provides limited import cover of approximately 2.5 months. The State Bank of Pakistan targets reserve accumulation to 3-4 months of import cover over the medium term.
Currency stability remains a key challenge, with the Pakistani rupee depreciating from PKR 102/$ in 2015 to PKR 278/$ in 2024, representing a cumulative depreciation of 172%. The sharp depreciation during 2022-2023, from PKR 162/$ to PKR 287/$, reflected acute foreign exchange shortages and loss of confidence. The subsequent stabilization around PKR 278/$ in 2024 indicates restored market confidence and improved external balances, though the currency remains vulnerable to external shocks.
Trade dynamics show persistent structural challenges, with imports consistently exceeding exports by significant margins. The State Bank's data reveals that energy imports constitute approximately 25-30% of total imports, making the country vulnerable to global commodity price shocks. Export diversification remains limited, with textiles accounting for over 60% of merchandise exports. The government's export promotion policies and focus on value-added sectors aim to address these structural weaknesses, though progress has been gradual. Capital flows, including worker remittances averaging $30-31 billion annually, provide crucial external financing, though their volatility adds to external sector uncertainty.
Financial Conditions
Key Financial Indicators (Latest Available)
Financial System Assessment
Pakistan's financial system has demonstrated remarkable resilience during the recent macroeconomic crisis, with banking sector indicators showing stable performance despite challenging operating conditions. The non-performing loan (NPL) ratio of 6.3% remains within manageable levels, though elevated compared to regional peers. State Bank of Pakistan's Financial Stability Review indicates that banks maintained adequate capital buffers throughout the crisis period, with the sector-wide Capital Adequacy Ratio remaining above the regulatory minimum of 11.5%.
Credit market conditions have normalized significantly following the acute liquidity stress of 2022-2023. Private sector credit growth surged to 35.8% in 2024, reflecting both base effects from the previous year's contraction and normalized monetary conditions. However, this rapid credit expansion warrants monitoring for potential asset quality deterioration. The State Bank's latest data shows that credit is primarily flowing to working capital requirements rather than fixed investment, suggesting continued caution among businesses regarding long-term commitments.
Equity market performance has been exceptional, with the KSE-100 index gaining 84% year-to-date in 2024, making it one of the best-performing markets globally. This rally reflects improved macroeconomic stability, foreign investor interest, and attractive valuations following the 2023 correction. However, market capitalization remains modest at approximately 15% of GDP, limiting the capital market's role in financing investment. Bond market conditions have tightened, with 10-year government securities yielding 12.06%, though this represents a significant decline from peak levels above 20% during the crisis.
Financial stability risks remain elevated despite recent improvements. The banking sector's large exposure to government securities (approximately 45% of assets) creates interest rate and crowding-out risks. Additionally, the rapid credit growth and improved risk appetite could lead to asset quality deterioration if economic conditions worsen. The State Bank continues to emphasize prudential supervision and stress testing to identify potential vulnerabilities. Overall, while financial conditions have improved markedly, the system remains vulnerable to external shocks and requires continued vigilance from regulators.
Pros & Cons
Strengths
- Current account achieved surplus of $1.5 billion in 2024, first positive balance since 2015
- Foreign exchange reserves recovered to $14.5 billion, providing 2.5 months of import cover
- Inflation declined dramatically from 29.2% peak to 4.1%, approaching central bank target range
- Real GDP growth recovered to 2.5% in 2024 after 2023 contraction, demonstrating economic resilience
- IMF Extended Fund Facility provides $7 billion financial backstop and policy credibility
- Banking sector NPL ratio at manageable 6.3% despite crisis pressures
- KSE-100 equity index gained 84% year-to-date, reflecting improved investor confidence
Concerns
- Public debt at 80% of GDP remains elevated and vulnerable to shocks
- Fiscal deficit at 6.8% of GDP exceeds sustainable levels, constraining policy space
- Interest payments consume 45% of government revenues, limiting developmental spending
- Pakistani rupee depreciated 172% since 2015, reflecting persistent external imbalances
- Foreign exchange reserves provide only 2.5 months import cover, below adequate levels
- Core inflation at 9.7% remains well above headline, indicating persistent price pressures
- Industrial sector share declined from 20.9% to 18.2%, signaling deindustrialization
- Labor force participation at 32.5% remains low, particularly for women
Outlook and Resilience Score
Macroeconomic Outlook
Pakistan's macroeconomic outlook presents a cautiously optimistic trajectory, contingent on continued policy implementation and external stability. The successful navigation of the 2022-2023 crisis has restored market confidence and established a foundation for sustainable growth. With inflation normalizing, external balances improving, and financial conditions stabilizing, the economy is positioned for gradual recovery over the medium term.
However, significant structural challenges remain that could undermine this positive trajectory. The elevated debt burden, persistent fiscal deficits, and limited foreign exchange buffers leave the economy vulnerable to external shocks. Success will depend critically on the government's ability to implement difficult structural reforms, maintain fiscal discipline, and build adequate reserve buffers. The IMF program provides important anchor effects, but sustainable improvement requires addressing underlying competitiveness and institutional weaknesses that have contributed to Pakistan's recurring balance of payments cycles.
Macro Resilience Rating
The rating reflects Pakistan's current stabilization following acute crisis, with improvements in inflation, external balances, and financial conditions. However, elevated debt levels (80% of GDP), limited forex reserves (2.5 months import cover), persistent fiscal deficits (6.8% of GDP), and structural vulnerabilities prevent a higher score. The economy remains vulnerable to external shocks despite recent improvements.
Disclaimer
Data Sources and Methodology
All data presented in this dashboard are sourced from official and publicly available datasets, including the State Bank of Pakistan, Pakistan Bureau of Statistics, Ministry of Finance, International Monetary Fund, World Bank, and other recognized statistical authorities. Data reflect actual release dates and may differ from fiscal year adjustments or rebased figures published elsewhere.
Investment Disclaimer
This content is for informational purposes only and does not constitute investment advice. The analysis presented herein is based on historical data and current information available at the time of publication. Economic conditions, policy frameworks, and market dynamics can change rapidly and materially affect the analysis and conclusions presented.
Investors should conduct their own due diligence and consult with qualified financial advisors before making any investment decisions. Past performance is not indicative of future results, and all investments carry inherent risks including the potential loss of principal.
Data Limitations
While every effort has been made to ensure data accuracy and completeness, users should note that economic data are subject to revisions, seasonal adjustments, and methodological changes by statistical authorities. Some data series may have limited historical coverage or frequency constraints that affect comprehensive analysis.
Forward-Looking Statements
Any forward-looking statements or projections contained in this analysis are based on current information and assumptions that may prove incorrect. Actual results may differ materially from those projected due to various factors including but not limited to changes in economic conditions, policy decisions, external shocks, and market dynamics.